

ServiceNow is built on a unified relational data model that captures how assets relate to one another, how accounts connect to locations, and how teams support systems and customers. These relationships are core to the platform and are modeled and maintained as part of day-to-day operations across standard and custom use cases.
While this relationship data is readily available, the challenge often lies in how it is surfaced and navigated in practice, especially as organizations extend the platform beyond out-of-the-box tables and views. Unified Maps address this challenge by transforming existing relationships into a visual structure that can be explored directly, without requiring custom user interface development.
This guide walks through what Unified Maps are, where they make sense, and how they are typically implemented, with a focus on using capabilities already available within the ServiceNow platform, without introducing unnecessary custom UI work.
What Is a Unified Map in ServiceNow?
A Unified Map is an interactive data visualization. It is one of Service Now’s out-of-the-box solutions designed to enhance records and reports with a clear visual layer.
Instead of navigating across tables, records, and related lists, Unified Maps present those relationships visually. They help users understand how components are connected, spot patterns quickly, and interact with data more intuitively.
At its core, it is a node graph:
- Nodes represent records such as assets, people, accounts, or locations.
- Edges represent relationships between those records.
- Layouts let users explore those relationships visually and interactively.
Unlike custom-built visualizations, Unified Maps are an out-of-the-box solution that can bind your data to them instead of building everything from scratch.
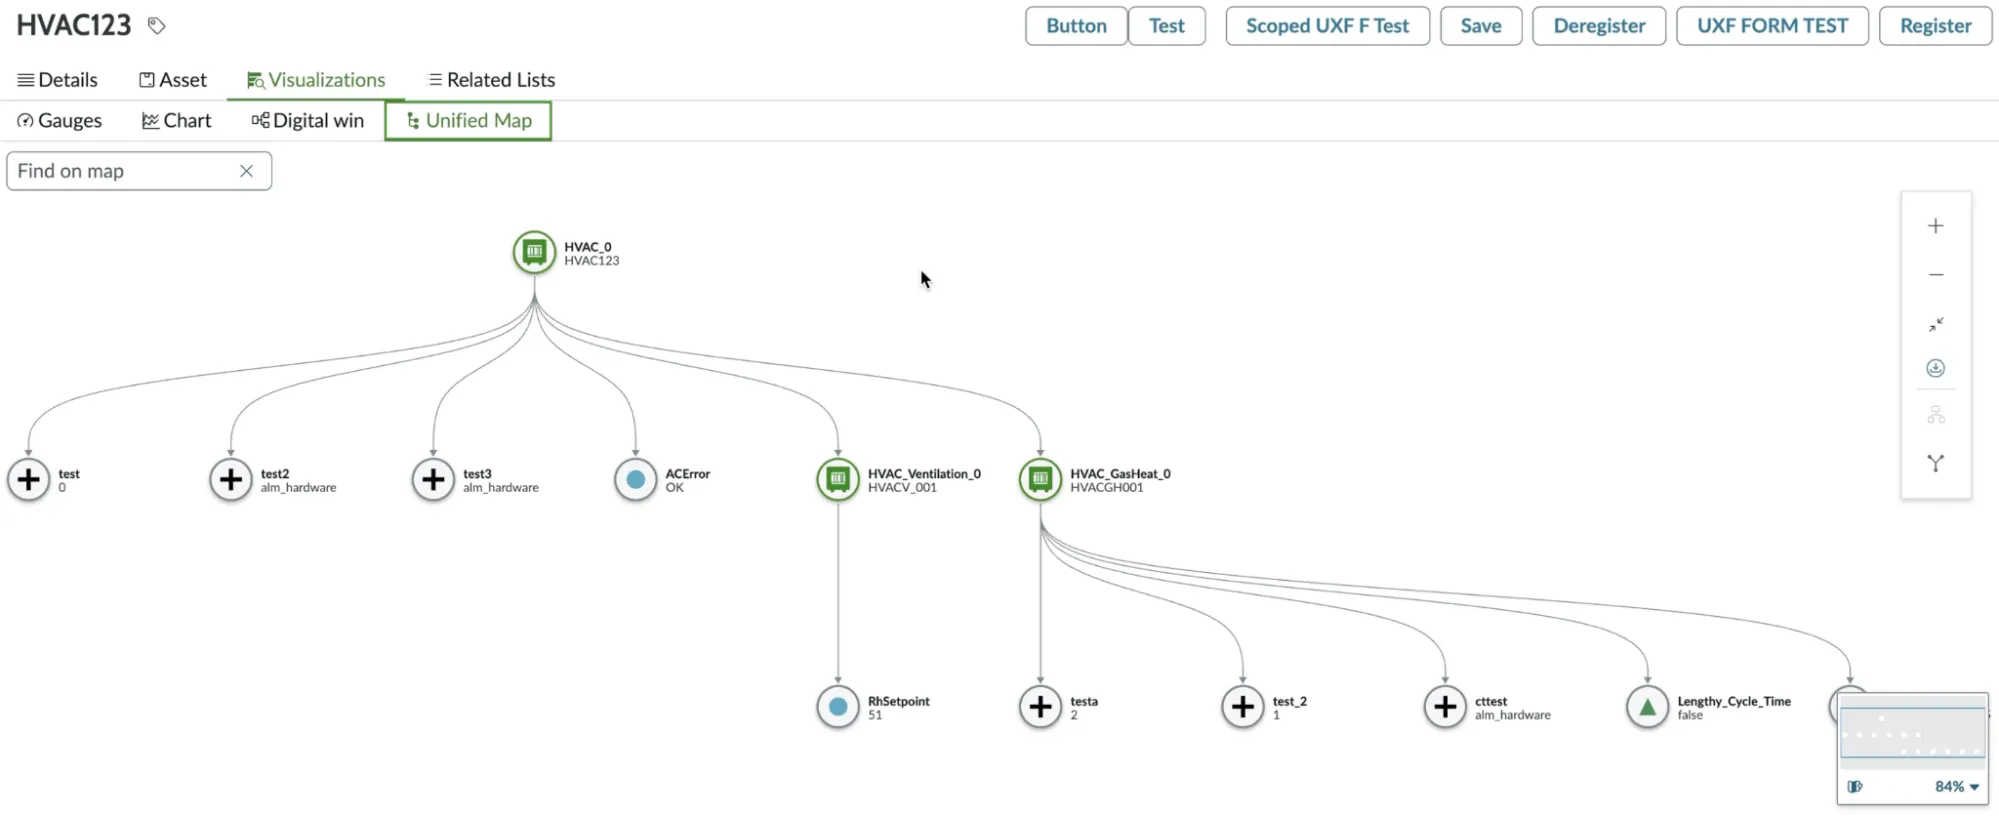
Unified Map of Connected Assets (IoT)
The Unified Map below presents a digital twin of the asset hierarchy, incorporating associated IoT sensors, calculated fields, and alert conditions. It delivers a clear, at-a-glance view of critical IoT data for the connected asset being serviced or repaired, enabling faster understanding and more informed service actions.
Why Unified Maps Matter
Most ServiceNow instances already have well-defined relationship data. The limiting factor is how easily those relationships can be viewed and worked with.
Unified Maps make hierarchy and connections visible in a single view. Relationships that would normally require navigating across multiple records can be explored directly, without relying on static lists or manual cross-referencing.
From a developer’s perspective, Unified Maps reduce the need for custom visualization work. Since the component is provided out of the box, teams can rely on supported ServiceNow components instead of building and maintaining custom UI.
This results in less custom front-end code, fewer long-term maintenance concerns, and closer alignment with ongoing platform updates.
Common Use Cases Beyond IoT
Unified Maps can be used in any scenario that’s represented by a graph, including…
Asset and Configuration Hierarchies
Asset records have parent-child relationships defined out-of-the-box. A Unified Map displays those relationships visually, making it easier to see how systems, sub-assets, and components relate without opening individual records.
When assets are modeled as standard CMDB Configuration Items, Unified Maps can display their parent-child relationships without additional setup.

Organizational and Team Structures
In addition to physical assets, Unified Maps can represent people, roles, or responsibilities. For example, they can visualize:
- Managers and direct reports
- Support agents and assigned accounts
- Ownership of incidents, cases, or changes
Customer and Location Relationships
From a field service perspective, Unified Maps can surface how operational records connect across customers, locations, assets, and work.
Out of the Box
If relationships already exist through reference fields or related lists, Unified Maps can visualize them directly. For example:
- Customer → Location
- Location → Asset
- Asset → Work Order
- Manager → Account or Employee
When You Build
If you need to visualize relationships that span multiple applications or use custom tables, you define the node and edge datasets yourself. For example:
- Cross-application service and Asset 360 views combining assets, work orders, cases, service contracts, and ERP pricing.
- Custom ownership or governance models showing account-to-location-to-asset hierarchies and sibling asset relationships.
- Aggregated operational dashboards injecting live IoT telemetry alongside active work and coverage data.
- Revenue, warranty, performance, or SLA overlays tied directly to operational and financial records.
No custom UI is required. The Data Resource described below acts as the connective layer, binding your relationship data so Unified Maps can visualize it instantly. The visualization component stays the same. What changes is how you shape the data feeding it.
How Unified Maps *Actually* Work
Unified Maps are built around a small set of core concepts:
- Data retrieval
- Node and edge definition
- UI binding
Each map is driven by two datasets:
- A list of nodes
- A list of edges that define how those nodes connect
Layouts and groupings can be applied on top of that structure, but the underlying model remains the same.
Once the node and edge data are bound to the Unified Map component, rendering and interaction are handled by the platform.
A Step-by-Step Guide to Building a Unified Map
Step 1: Create a UI Builder Component
Instead of embedding everything directly into a page, wrap your Unified Map inside a custom UI Builder component.
This keeps your logic:
- Organized
- Easier to debug
- Easier to reuse and extend
It also lets you preview and test in isolation.
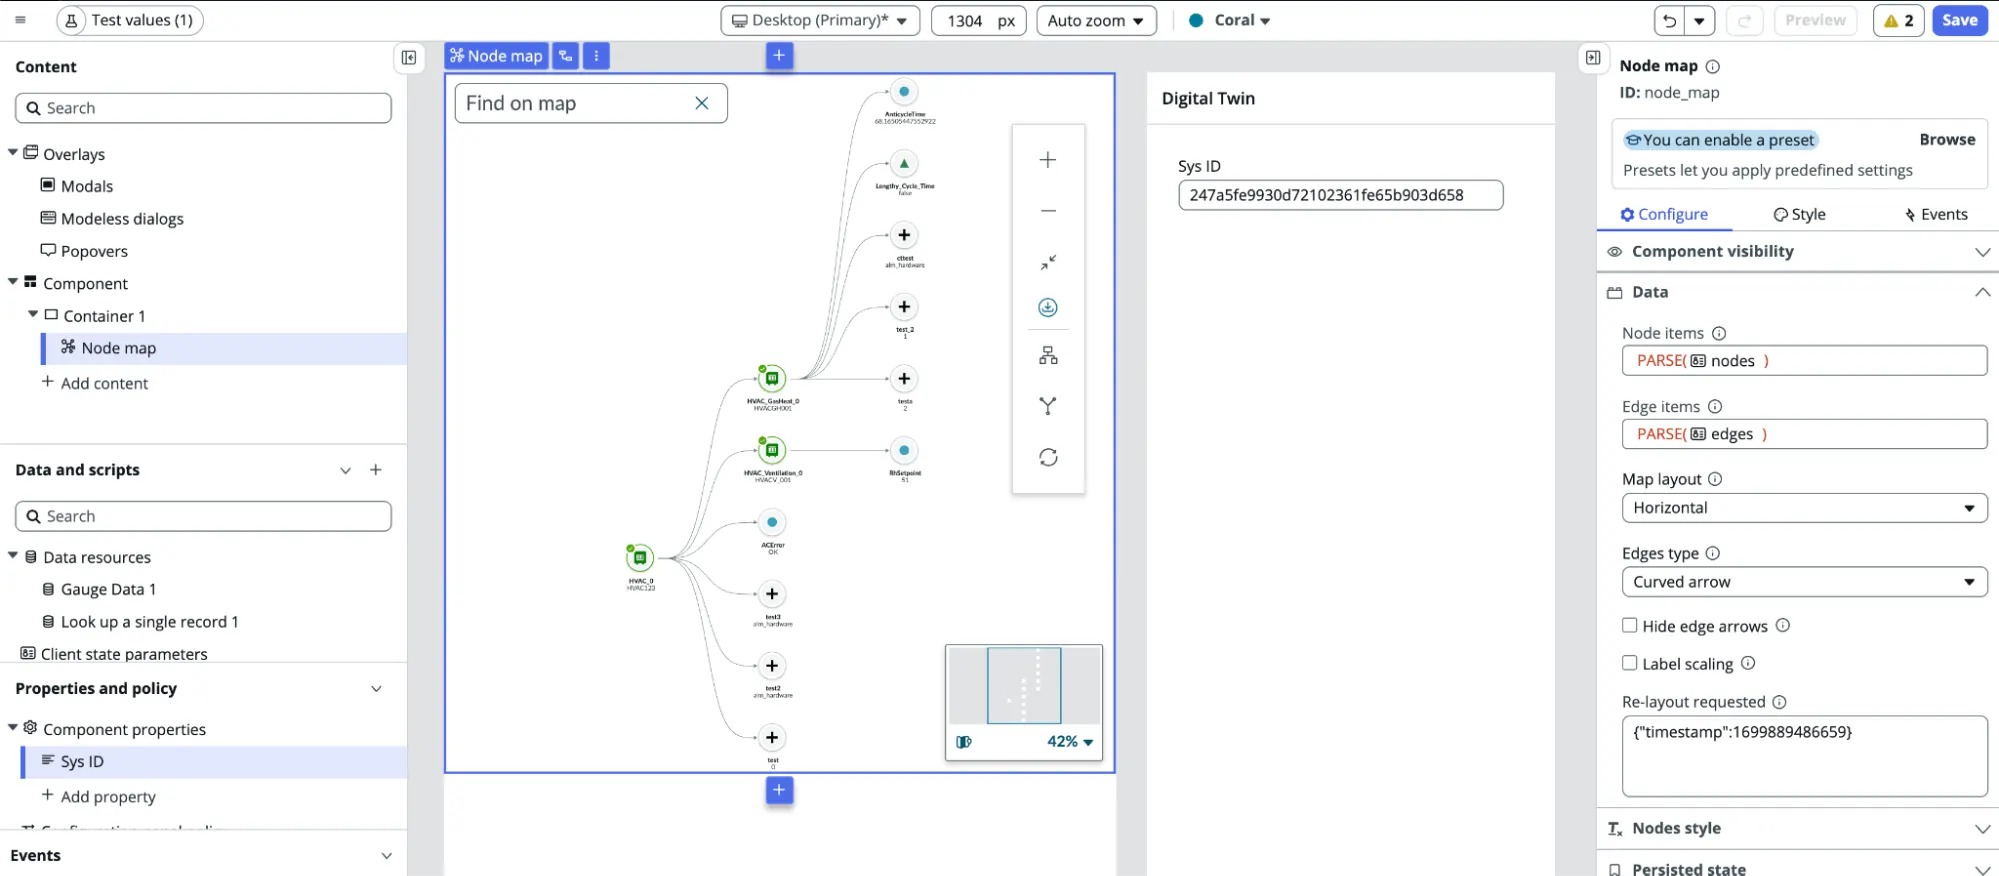
Step 2: Add the Node Map Component
Inside your custom component, add the standard Unified Map or Node Map component.
This is the base visualization provided by ServiceNow. No custom rendering is required to get started.
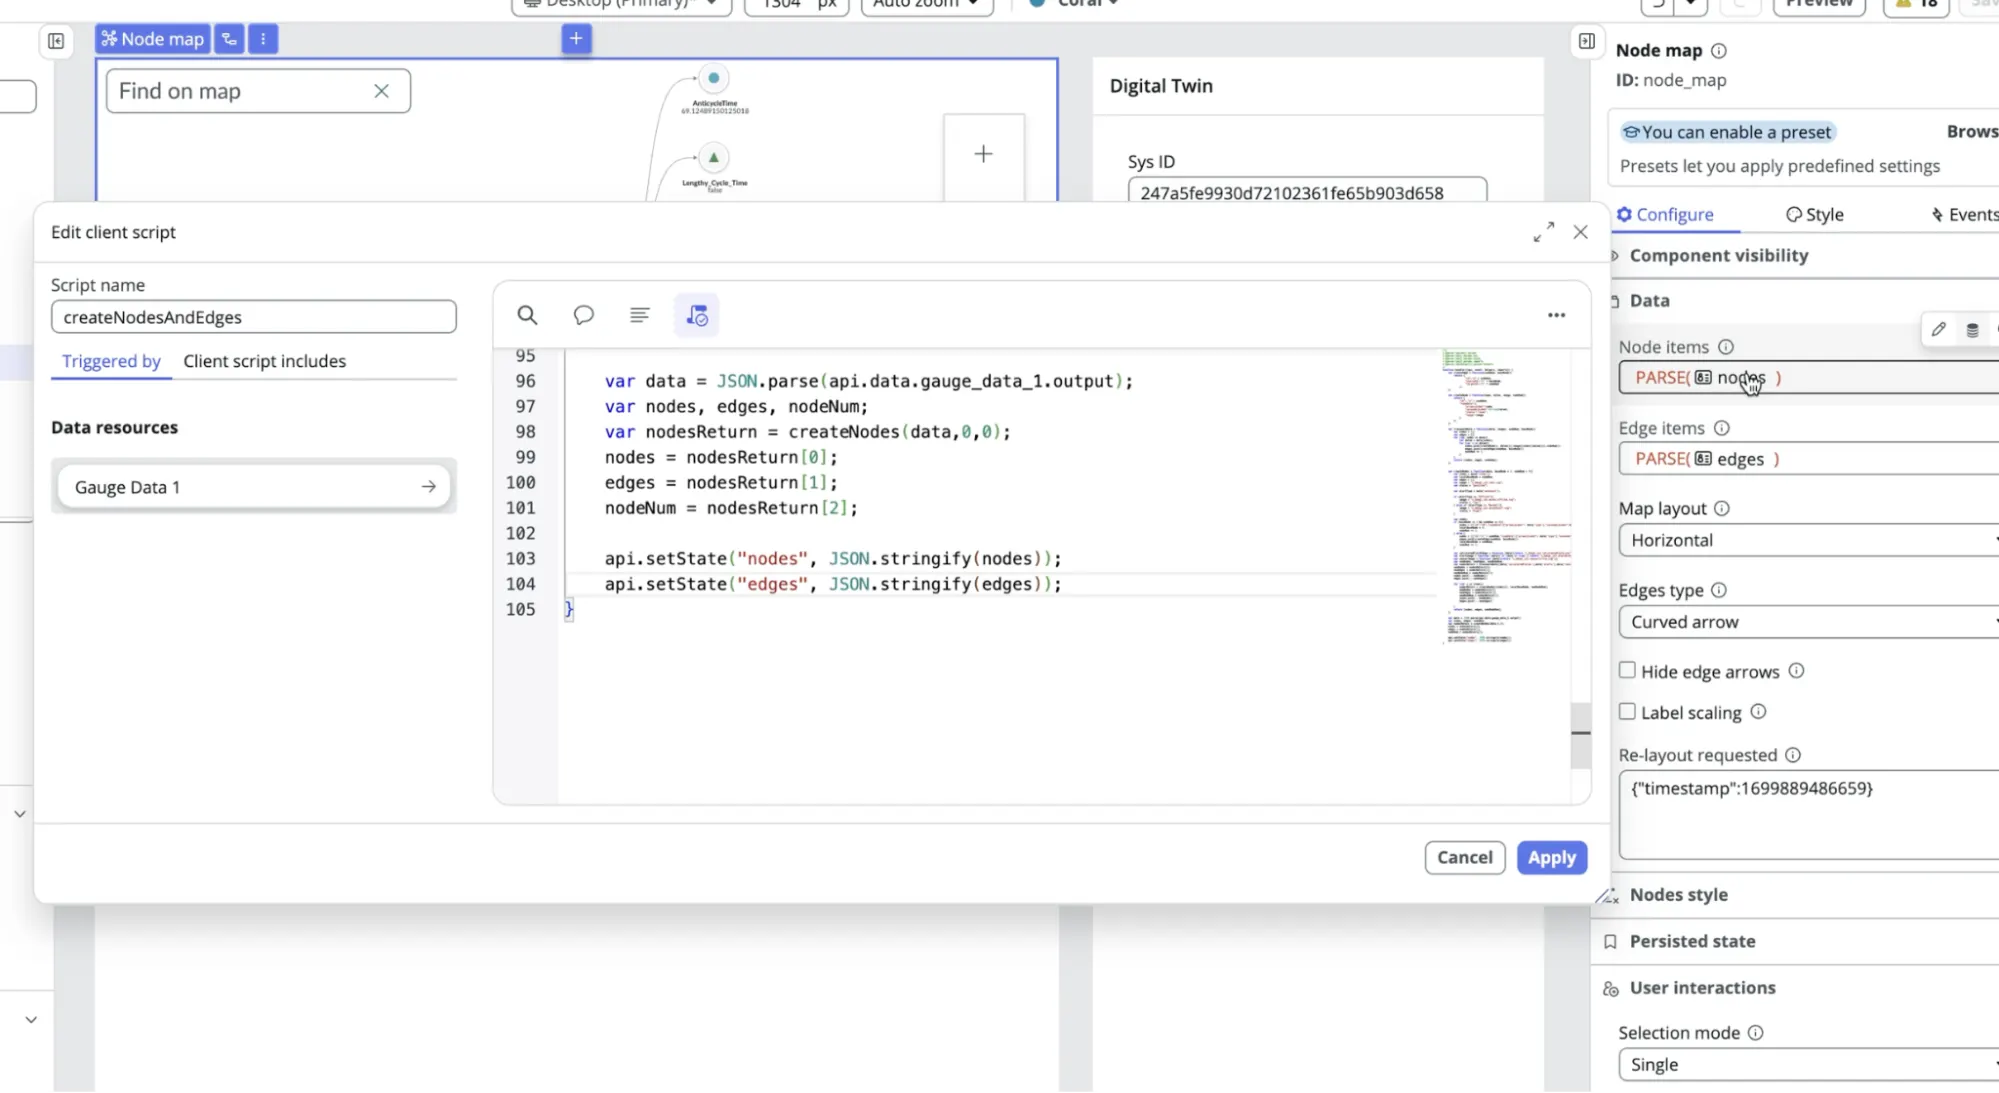
Step 3: Retrieve Data Using a Data Resource
Use a data broker or data resource to retrieve the records you want to visualize.
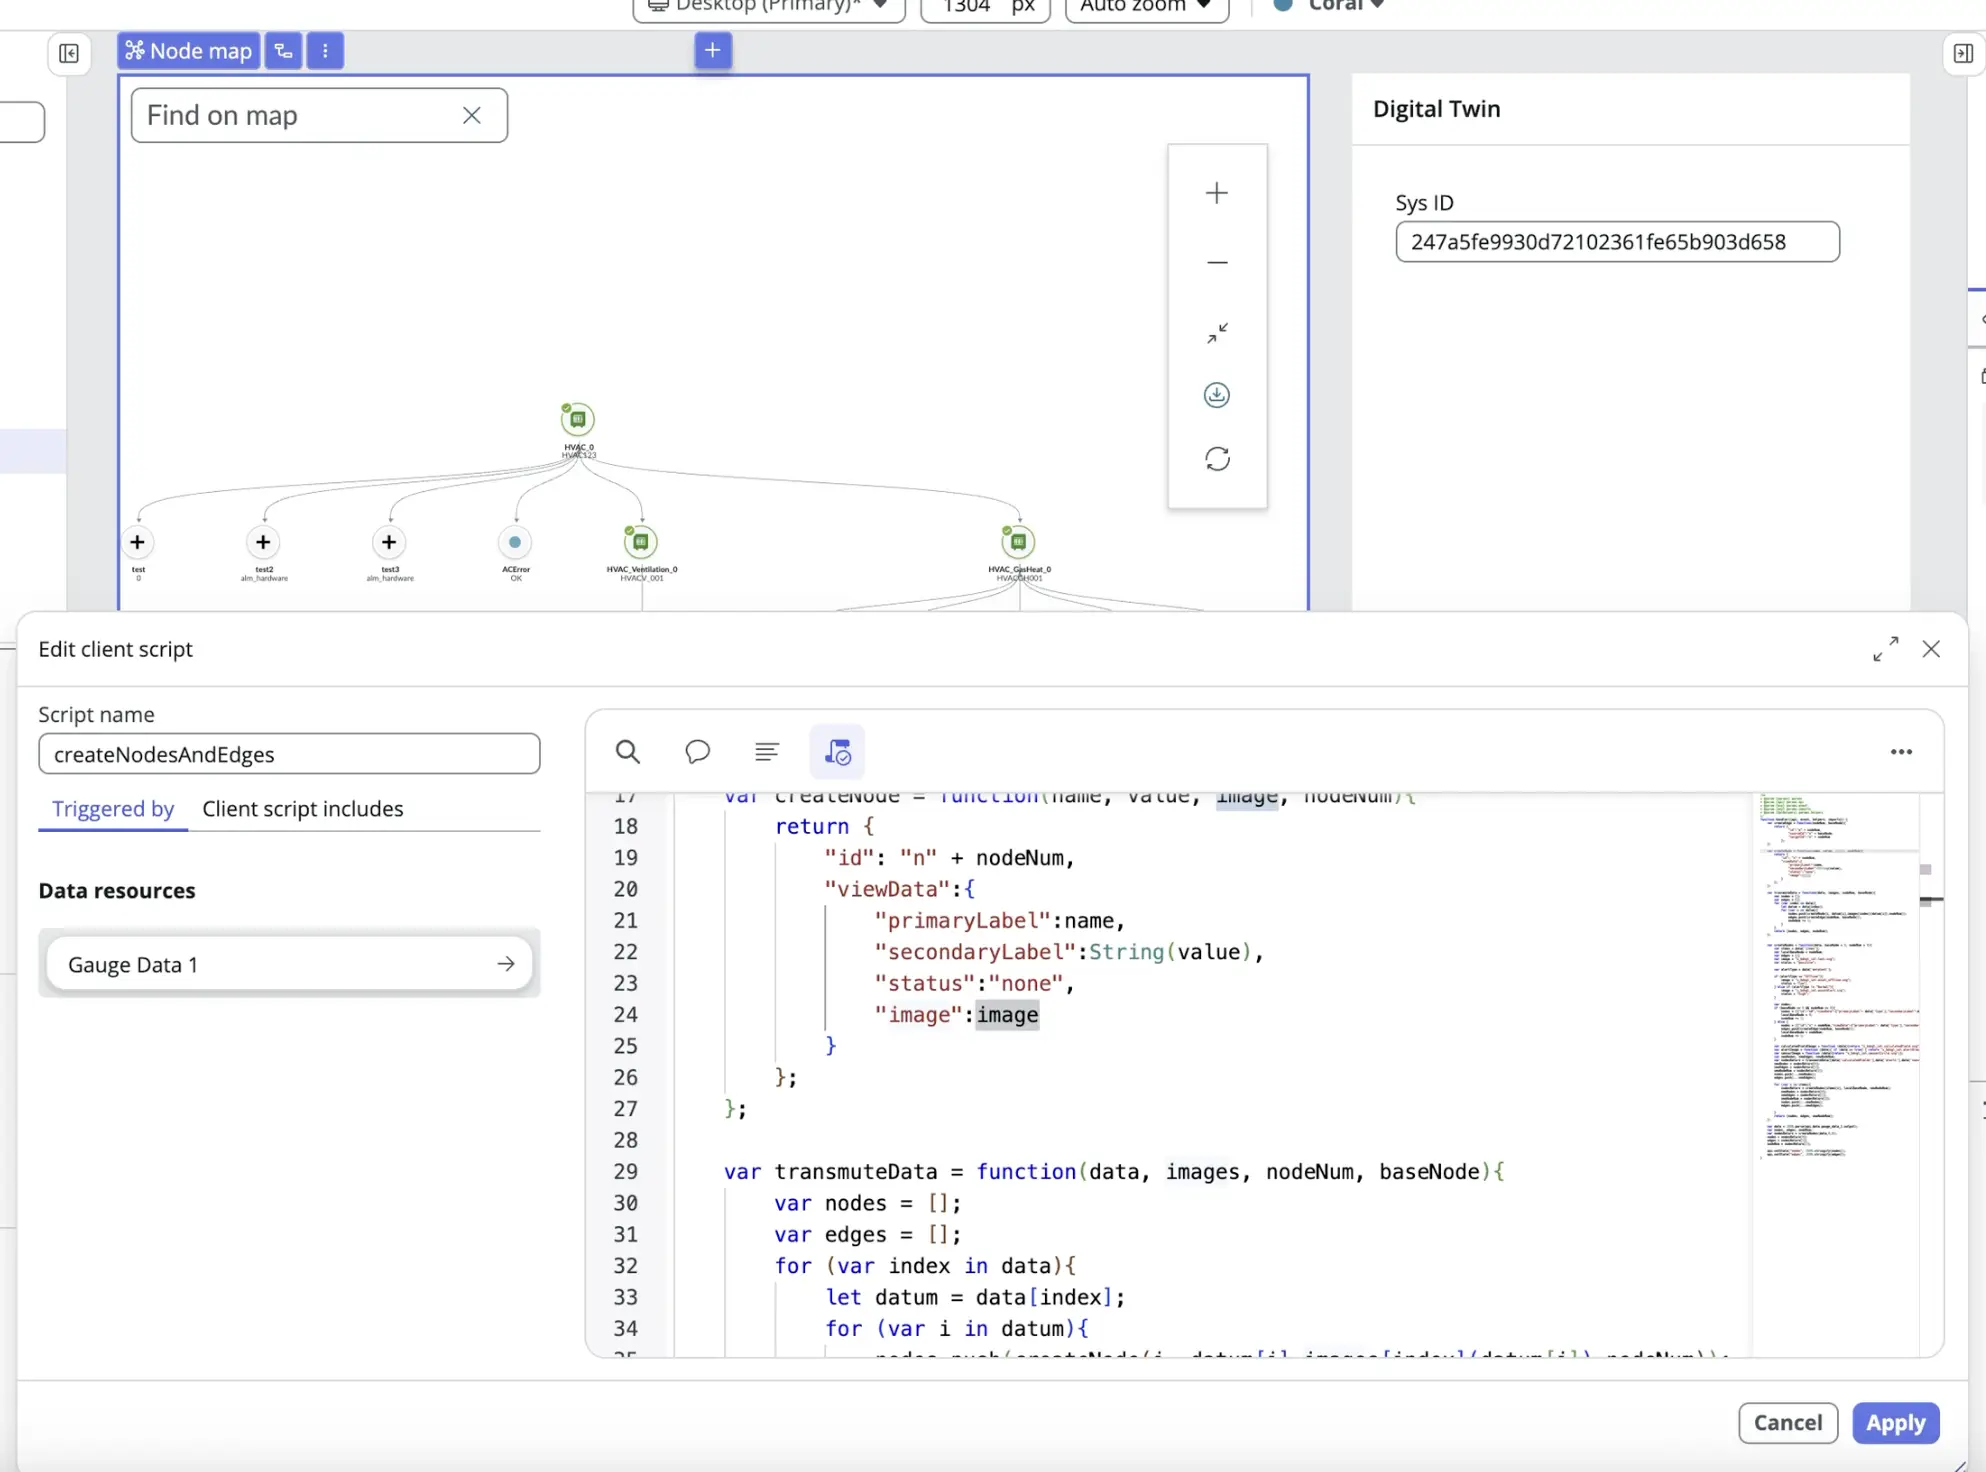
Once the data is returned, process it with a client script and convert it into two arrays: nodes and edges.
Each node defines things like:
- ID
- Label
- Status
- Optional Grouping
- Optional Image
Each edge defines how nodes connect.
Step 4: Bind Data to the Map
Bind your node and edge arrays to the Unified Map inputs using client state variables. The map will update automatically when the client state variable data changes.
This is the part of the process where the visualization comes to life.
Step 5: Add Interactivity With Custom Buttons
Unified Maps support custom control panel buttons.
For example:
- A Refresh button that reloads data
- Filters or toggles for different views
To add one:
- Set the button behavior to Custom
- Bind the click event to your own handler
- Trigger a data resource refresh or state update
Tip: Unified Maps use workspace icon sets, not the classic ServiceNow icons. Look for outline and filled workspace icons when choosing visuals.
Customizing Nodes and Visuals
Unified Maps support more customization than the documentation suggests.
Images and Status Indicators
Nodes can display images based on values such as:
- Status
- Capacity
- Type
- Profile Picture
This allows:
- Color-coded states
- Custom icons
- Visual cues without extra text
- Easy Identification of Users
Note: Image configuration exists in the schema, but it can be missed easily and is not clearly documented.
Layout Options and Platform Versions
Layout support depends on your ServiceNow version.
If you have Zurich, you’ll have access to additional layouts, such as Unified Vertical. If you use Yokohama, there are fewer layout options.
Tip: If you’re building something with specific layouts in mind, make sure to specify supported versions.
Where to Place Unified Maps in the UI
Unified Maps are added at the page level, not per record.
Common placements include:
- A Visualization tab on an asset record
- A workspace page for operations or service teams
- A custom dashboard for leadership or monitoring
Once the component is placed on a page, it can automatically adapt based on the data binding.
Adoption Tips for Teams
Use Placeholder/Snapshot Data During Development
To ensure your data will display properly in the UI Builder preview window, take a snapshot of the data you dynamically bind to your state variables, bind that to an input state variable, and use that as a placeholder during development.
This allows changes you make in UI Builder to be consistently reflected in the UI Builder Preview window in real time. Dynamic bindings can sometimes cause preview windows to render empty data, even when the live preview works correctly.
Start With One Clear Use Case
Avoid trying to visualize everything at once. Pick a single relationship problem and solve it well, and then move on to the next one. Too many nodes quickly make the unified map harder to navigate.
Avoid Over-Customization
The out-of-the-box component handles most needs. Only build custom node components if you truly need them.
Wrap Everything in a Component
This is the biggest recommendation for developers. It keeps development organized, allows for easy reuse across pages, and ensures future changes are made once and applied everywhere.
Documentation Reality Check
Unified Map documentation exists, but it is:
- Often outdated
- Mostly broken
- Missing key details like image support
Expect to experiment. The good news is that once you understand the JSON schema, Unified Maps are extremely powerful and easier to configure.
How Bolt Data Can Help
From strategy through execution and optimization, Bolt Data helps ServiceNow customers turn investment into measurable results across CRM, service, and operations.
Book a call with one of our ServiceNow specialists to understand how we can help you.
Final Thoughts
Unified Maps are one of those ServiceNow features that unlock meaningful value by helping teams visualize complex relationships, reduce navigation friction, and make more informed decisions. For developers, they represent a rare win: powerful visualization without rebuilding the wheel.
If you’re already paying for ServiceNow, Unified Maps are worth using.